Cepheid variable star
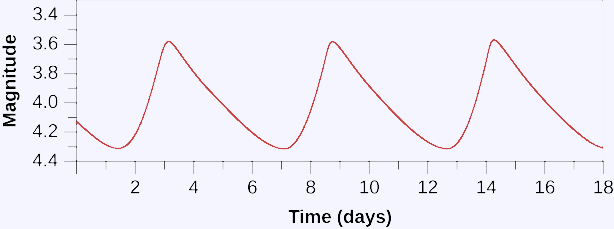
Some stars are seen to vary in brightness and, for this reason, are called variable stars. This light curve shows how the brightness changes with time for a typical cepheid variable, with a period of about 6 days.
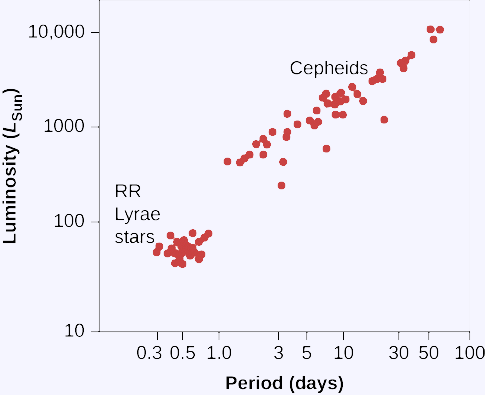
Periods and average luminosities turn out to be directly related, the longer the period (the longer the star takes to vary), the greater the luminosity.
Period-Luminosity Relation for Cepheid Variables (we are able to obtain its linear regression by this graphic).
How to Use a Cepheid to Measure Distance.
- Find a cepheid variable star and measure its period.
- Use the period-luminosity relation to calculate the star's luminosity.
- Measure the star's apparent brightness.
- Compare the luminosity with the apparent brightness to calculate the distance with the following formula:
d=10(m-M+5)/5 .