WASP-35
WASP-35 is a G-type main-sequence star about 620 light-years away, discovered in the year 2011. It is located in the constellation of Eridanus. Orbital period (Earth days) 3.1616
Telescope: Cecilia in Amado, AZ, Mountain Standard Time
Selected Date: 2021-11-30 Selected Time: All hours
The telescope detect itself as a significant amount of noise to the digital images. So, using dark images is the way to avoid it.
A dark image is an image of the same exposure time but taken with no pick filter over the detector. In other words, no light is leading from the stars, only the electronic signal of noise the detector itself gets recorded.
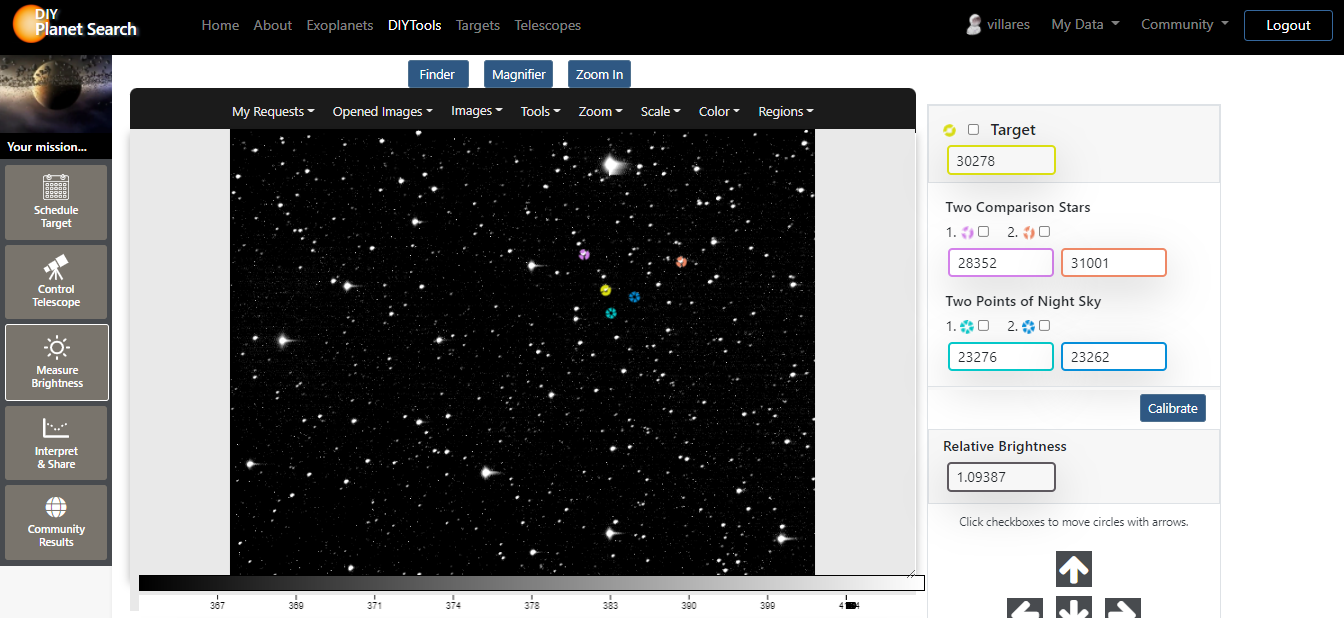
It is necessary to subtract that electronic dark noise from each image, so it will not interfer with the measurements. Click on "calibrate" button and see how the value of the targets go down.
Now, to find the star, place the top yellow circle around the darkest star. The next two, purple and orange, should be placed around two comparison stars (stars that do not change the brightness much).
No calibrated image
Calibrated image
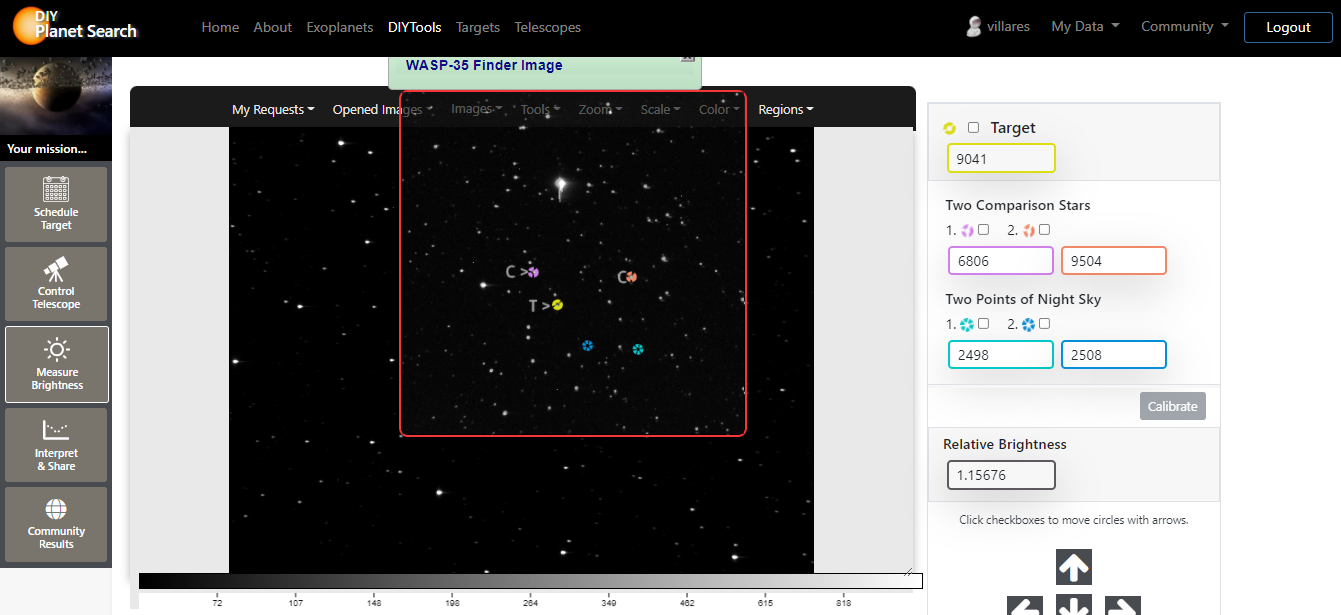
To find the comparison star, open the finder. A transparent moving transparent chart lavels the star. Look for two stars with the same bright. Put the finding chart over the image and align the stars of the chart with the ones in the image. Once the stars are aligned, drag the tap yellow target circle to the star (laveled with the T) and the other two with the two comparison stars (leveled with the C). REMINDER: do not worry about getting the exact position.
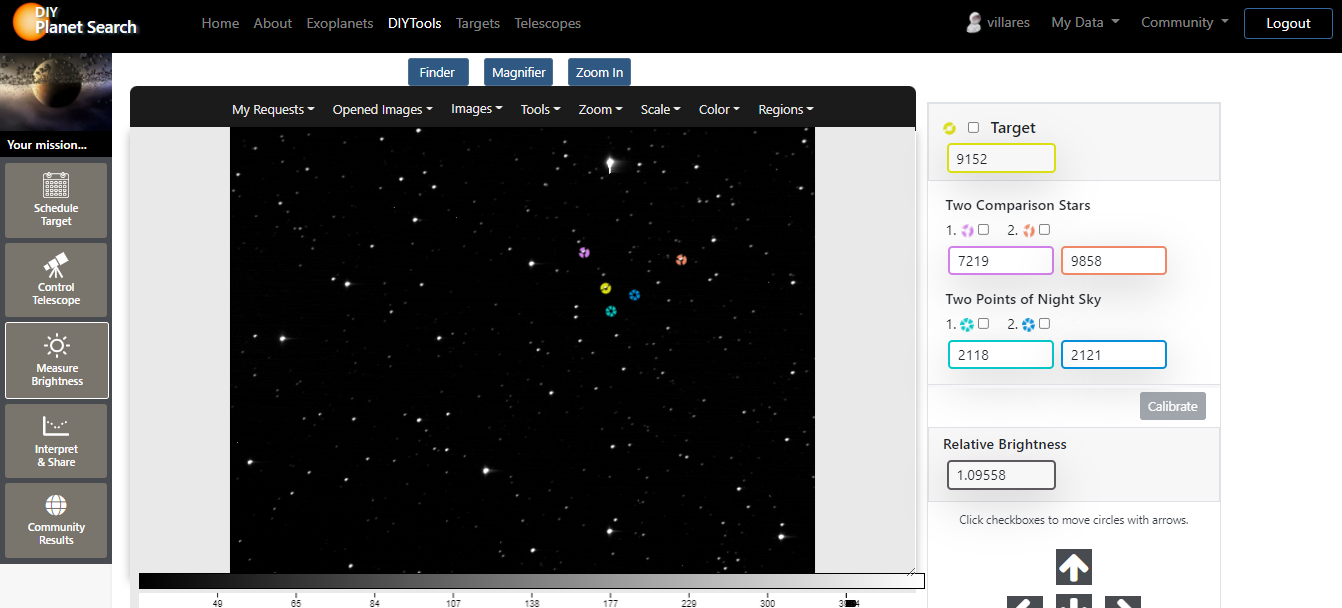
Now, it is ready to measure. First, close the finder image chart and open the magnifier window to inspect weather the circles are really exact in where you want them to. Additionally to the two stars comparision circles, there are two others to subtract the brightness pixels of the night bright sky. Position this two blue circles near the target star and, using the magnifier, make sure that where you place them, there are no stars. One more important step, open one of the dark images before going on calculations and calibrate another time. The brighness of the target star is divided by tha average of the two comparison stars and that is the reason why it gets recorded when you click on the calculate and record button.
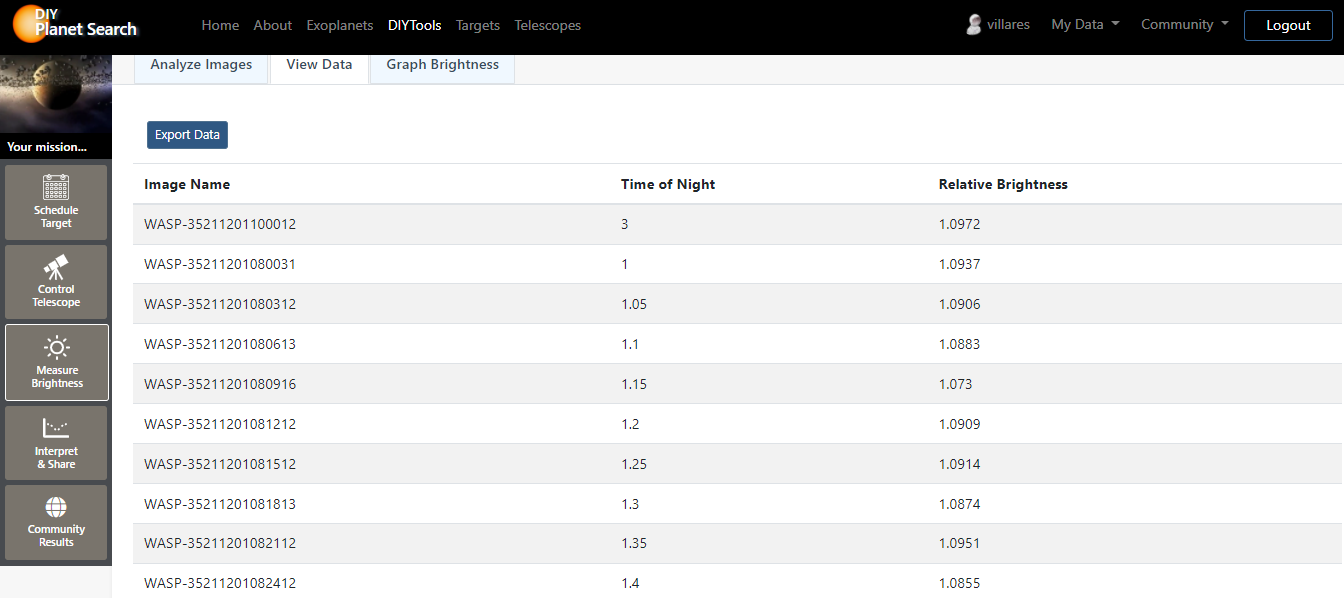
Click on the View Data to see a table view of your night measurements for each image by time of night. Now, make your brightness mesurements image by image by opening up the next image in My Requests and repeat the same steps with the next images. REMINDER: calibrate before calculating and record.
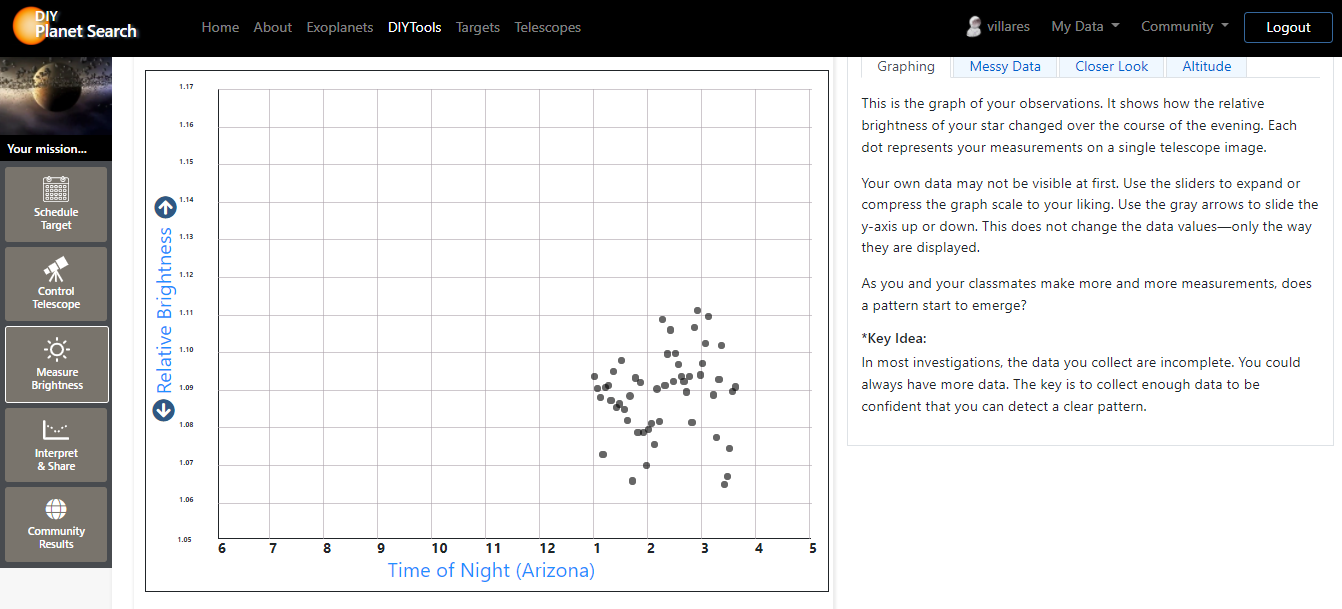
Doing this, you have a complete light curve that just may contain the evidence that you detected an exoplanet. This is the graph of my observations. It shows how the relative brightness of the star changed over the course of the evening. Each dot represents my measurements on a single telescope image. The data may not be visible at first. Use the sliders to expand or compress the graph scale to your liking. Use the gray arrows to slide the y-axis up or down. This does not change the data values—only the way they are displayed. KEY IDEA: in most investigations, the data collected is incomplete. You could always have more data. The key is to collect enough data to be confident that you can detect a clear pattern.